Project Name
Nemesysco
Focus
Adjusting UX and Optimizing App Design
Tech Stack & Tools
Figma, JavaScript, After Effects
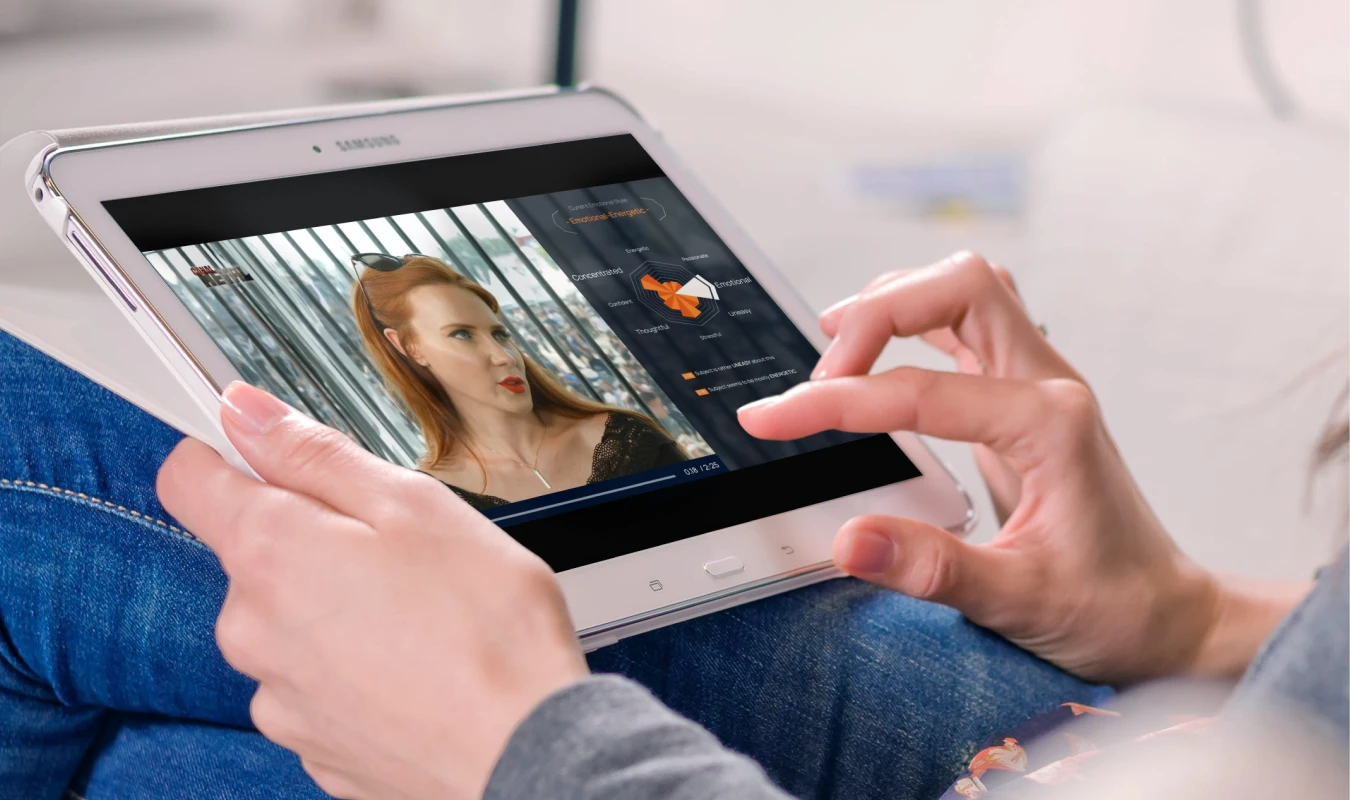
Nemesysco's app is a unique blend of technology and implementation. The app design needed to be simple and present a ton of information in real time, all while focusing the viewer on the important parts of the app.The challenge was to come up with a progressive disclosure of information and emphasizing different parts of the app at varying intervals.
The Problem
Nemesysco required a desktop interface for their deep-tech voice and emotion analysis software. While the underlying machine learning engine analyzed only audio data, the interface needed to display a synchronized video feed alongside the real-time emotional telemetry. The primary UX challenges were twofold: managing severe cognitive load (ensuring analysts could monitor the subject without missing data updates) and enabling efficient retrospective review (allowing researchers to quickly find critical moments in hours of footage).
Barebones UI was lacking features
The old interface lacked essential shortcuts to key timeline milestones and offered no immediate, real-time synthesis of the subject's emotional state, causing user fatigue.
The Process
Interface State Mapping (Time-Based UX)
Managing user expectations before and during AI output by establishing clear temporal states. I designed a clear visual progression to dictate exactly what the user sees from standby to full synthesis.
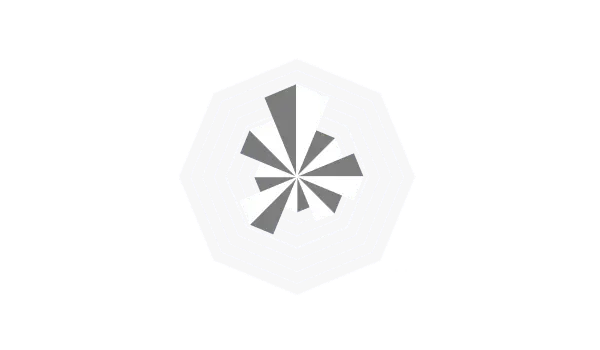
Phase1: System Calibration
Initially, the core emotional diamond is present but the data rays are silent. Because the AI requires time to calibrate a baseline emotional state, I introduced a continuous "swooping" micro-animation. This provides immediate, critical system feedback—reassuring the analyst that the application is actively processing the audio stream, rather than stalled or frozen, before the real-time data begins.
Phase 2: Active Analysis
Once audio input is detected, the radar animates in real-time. To allow immediate value assessment without cluttering the interface with numbers, I enhanced the diamond graphic with subtle background gradations, making the 50% threshold line slightly thicker to serve as a quick-reference baseline. This keeps the layout "quiet" while focusing the user's attention entirely on the live geometry shifts.
Phase 3: Macro-Level Synthesis
To summarize the subject's overarching mood, a "Current Emotional Style" indicator was integrated above the diamond. Because it updates infrequently—only changing when a macro state shifts—I minimized its visual weight to keep the primary focus on the active radar. Its display is delayed until a baseline is established, ensuring it tracks long-term trends rather than fleeting micro-expressions.
Spatial Architecture (The Split-Attention Problem)
The original system utilized a "Picture-in-Picture" overlay for the LVA data. I analyzed the physical viewing habits of analysts and discovered this layout caused severe cognitive fatigue. I mapped the eye travel (saccades) to prove that a strict side-by-side layout was mathematically required to prevent missed facial micro-expressions.
The Problem: Floating Overlays
Forces complex diagonal eye travel and creates visual interference. The moving video behind the chart creates a constant figure-ground conflict for the brain.
1. Synchronous Interface Architecture
I designed a specialized split-view desktop layout that paired the video player directly with an adjacent data visualization panel. The goal was to ensure that the emotional telemetry (graphs, timelines, and confidence scores) mapped perfectly to the audio-visual timeline, allowing researchers to contextualize the data in real-time.

2. Diagnosing & Overcoming "Cognitive Tunneling"
- The Insight: User testing revealed analysts fixated so heavily on the video that they suffered from inattentional blindness, completely missing critical data panel updates.Threshold-triggered micro-interactions
- The Solution Kept the UI "quiet" during baseline states, but engineered threshold-triggered micro-interactions.
- Attention Hooks: When the AI hit a ≥89% confidence score, the UI deployed high-contrast color shifts and intentional motion to pull the user's eyes to the data exactly when it mattered.
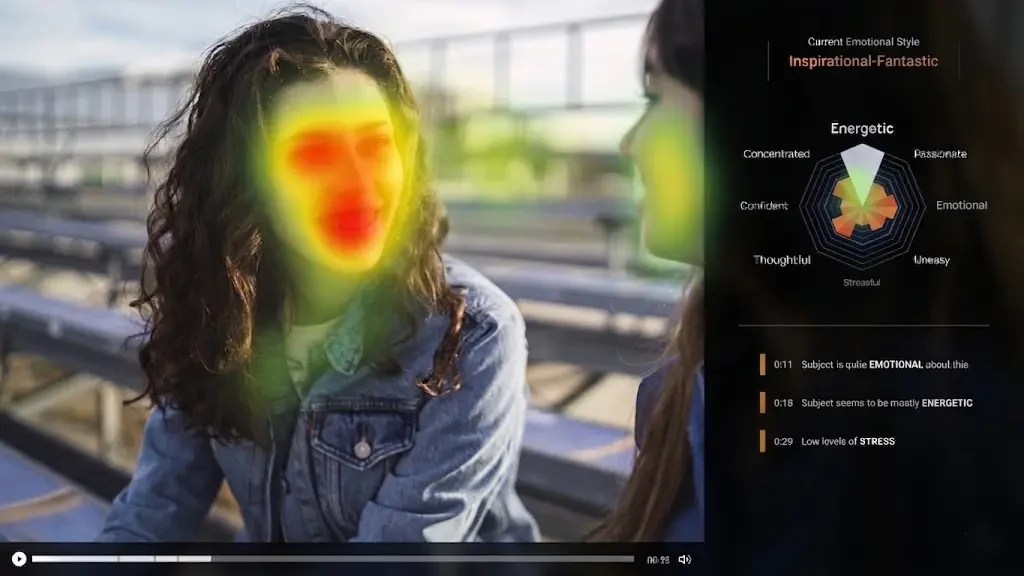
Current Emotional Style (CES)
Emotional Diamond
Emotional Snapshots
3. Event-Driven Timeline Navigation
Because deep-tech analysis requires heavy retrospective review, I designed an intelligent playback timeline. Whenever the system detected a significant shift in the subject's mood, the UI automatically plotted an interactive visual marker directly onto the video scrubber. This allowed users to instantly navigate the subject's emotional journey and jump directly to key milestones, rather than manually scrubbing through hours of raw footage.
Simone's interview used only for demonstration purposes
4. Designing for Fault Tolerance & Graceful Recovery
Instead of frustrating hard resets that destroy session data, I engineered a localized error state UI. It features an intuitive reload mechanism to gracefully recover the real-time data stream and keep the analyst's workflow intact.
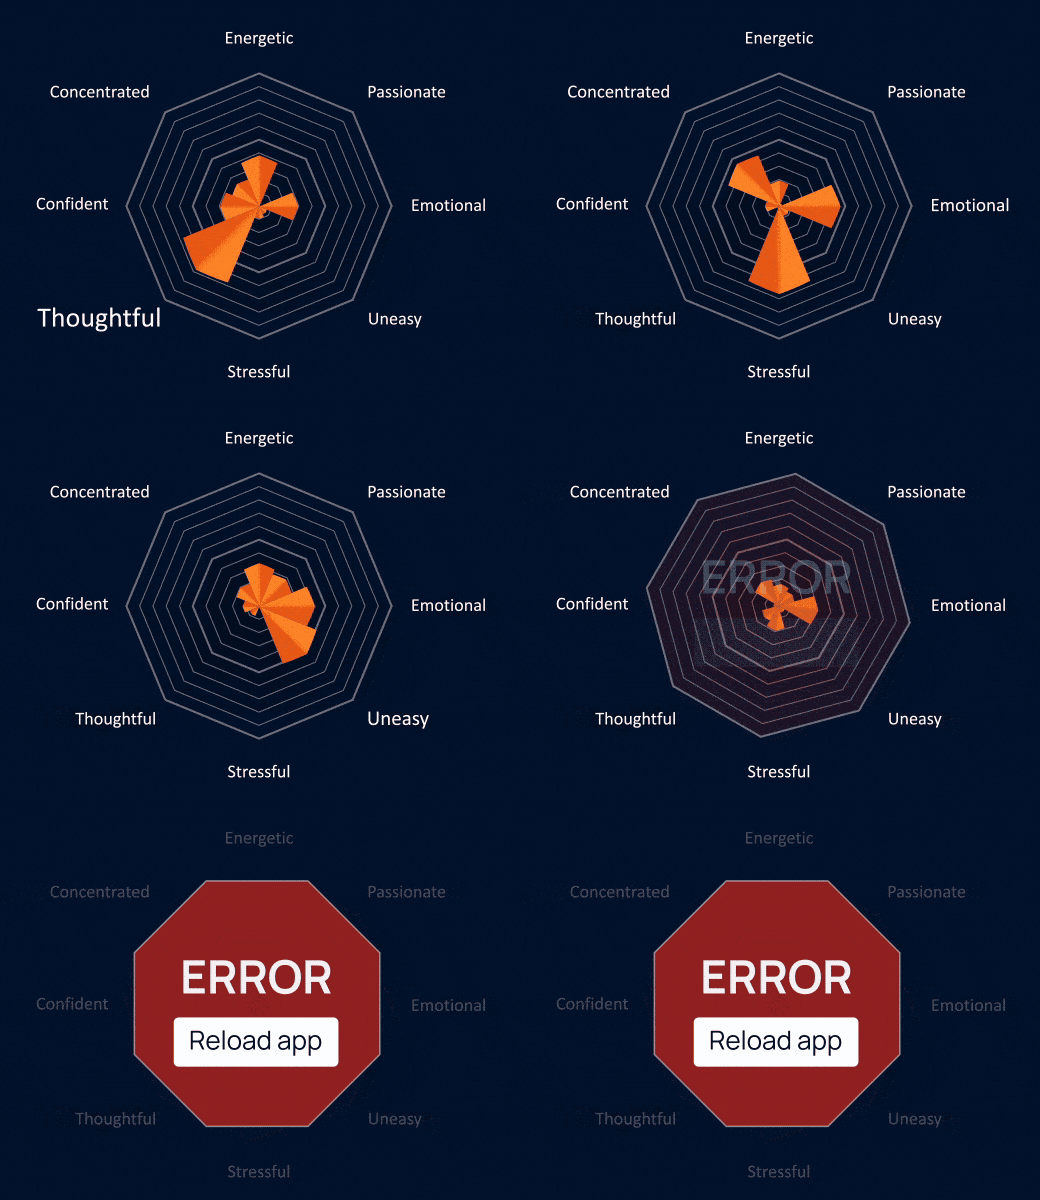
Beyond the Happy Path
To instantly signal a critical error, the standard diamond UI rotates into a universally recognized stop sign. A "Reload" button is embedded directly inside this focal point, placing the recovery action exactly where the user's attention is inherently drawn.
See the Pen Nemesysco timeline bars by Valery (@ValeryChe3000) on CodePen.
See the Pen Nemesysco Diamond by Valery (@ValeryChe3000) on CodePen.
Handoff? Hands-on!
Instead of relying on static mockups, I coded the UI animations directly in JavaScript and CSS so developers could instantly see how things worked under the hood. By contributing straight to our shared codebase, we skipped the traditional handoff and collaborated much more closely to get the feel exactly right.
The Outcome
I delivered a specialized, research-grade desktop interface that successfully synchronized video playback with complex, audio-derived data visualization. By utilizing research-driven motion design to manage cognitive load and implementing event-driven timeline markers for rapid navigation, the UI actively guides the analyst's attention and transforms raw audio telemetry into actionable, easily navigable insights.